
Question:
Month End Report. Manager’s Report. Board Package.
No matter the name, these reports are produced on a monthly basis for an association’s board of directors to analyze the operations of their community. Regardless of software package, these reports all have similar aesthetics in providing data around the health and efficiency of an association’s operations. A majority of board members lack the analytical literacy to see multiple columns of data and extrapolate necessary conclusions to aid them in running their association in the most efficient manner possible.
This reality should have many board members taking pause to explore ways to improve their monthly reporting in order to better meet their decision-making requirements along with educating homeowners on how their association is operating. The answer to address this lies in the foundation of performance management consulting: dashboards. Performance management dashboards allow an organization of any size to define critical activities and measure them in a visually meaningful fashion. Moreover, performance management dashboards will allow for greater control over the planning and strategy of the association in order to achieve set targets.
What are Performance Management Dashboards?
Performance management dashboards gained notoriety after initially being used in the 1950’s by a group of General Electric engineers to control costs within their development projects. An enhanced focus on quality in the United States in the 1970’s and 80’s, led by W. Edwards Deming, Eliyahu Goldratt and Peter Drucker, helped create the performance management standards represented today through dashboards. 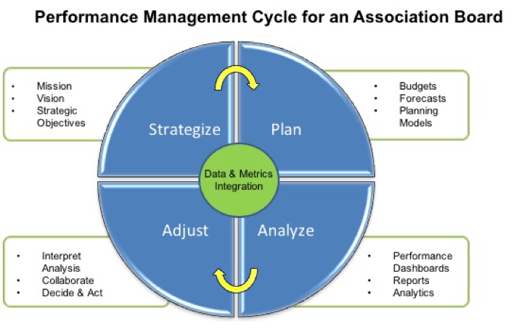
Performance management dashboards can be created for any number of reasons covering all levels of an organization. In the case of an association board, the primary driver to use performance management dashboards is to monitor major items within the association o on a regular basis along with providing board directors a consistent format of shared knowledge. A board director should be the primary audience for performance management dashboards as it provides them the ability to:
- Monitor critical processes and activities using performance metrics that surface potential problems
- Analyze root cause of problems by providing relevant and detailed information from multiple perspectives
- Manage processes to improve decisions, optimize performance, and keep the focus association on the right items
A performance management dashboard is the most logical tool to adopt for an association board looking to improve their performance.
It will allow a director, regardless of analytical literacy, to consume large amounts of data in a highly effective process termed visualization. Visualization refers to using interactive visual representations of notional based data to magnify analytical cognizance. Employing visualization in performance management dashboards is best explained through the cognitive fit theory. Cognitive fit theory focuses on the alignment of an individual’s decision making skills, the format of information presented and the anticipated task or decision facing the individual. For example, graphs are most effective when dealing with spatial items, like forecasting, that require multidimensional data analysis and pattern recognition. In contrast, information presented in tables, like an income statement, is most impactful for users who are more quantitative in nature.
Balanced Scorecards & KPI’s
The Balanced Scorecard (BSC) is a dashboard tool enabling an organization to translate its vision and strategy into a tangible set of performance measures. The BSC provides a holistic view of an organization’s overall performance by integrating core financial metrics with other key performance indicators (KPI’s) usually focused on customer viewpoints, internal processes and assessing the long-term growth prospects for the organization. When applied to a community association setting, a clearly defined BSC, with multidimensional structure for strategic performance measurement, needs to combine financial and non-financial strategic measures to deliver the most value to a board director.
Germane to creating value added BSC’s, is the creation of key performance indictors (KPI’s). KPI’s are tailored to measure the major activities of an organization with each fitting into one of two types: leading and lagging. Leading indicators measure activities that play a role in future performance, whereas lagging indicators, such as financial metrics, gauge the performance of a past activity. From a board member perspective, leveraging leading indicators will deliver the most value when making decisions that can shape the future of the community. When creating a set of KPI’s, a board needs to review some key items to judge if the indicator can be supported by their property management company’s reporting system along with tying it to a specific strategic goal. Some questions for a board to ask themselves when defining KPI’s are:
- What part of our strategic plan does this tie to?
- Can the indicator be quantified effectively?
- Is the indicator understandable?
- Does the indicator provide actionable steps to take?
- Does the data exist currently in the reporting system?
Answering these questions will create a set of meaningful KPI’s to deploy along with avoiding significant rework to adjust indicators not initially developed correctly.
Designing a Performance Management Dashboard to Fit Your Association
There are many items for a board to consider when creating a set of performance management dashboards. The following five questions will help lay the foundation for designing effective dashboards that will deliver the maximum results:
- Who is the true target audience?
The target audience of any association reporting should be its board of directors as they are the elected homeowners empowered to make decisions for the community. Homeowners should be able to understand the dashboard KPI’s in order to recognize where the board is placing their focus. To ensure success, it’s imperative for the board to recognize that the dashboards are intended for their use in managing community operations – not to satisfy every homeowner demand for information.
- Select the right type of dashboard
A community association board is a unique structure in that directors require a set of metrics encompassing the tactical, operational and strategic views of the community. Essentially, all traditional levels of management are singularly consolidated on the board directors. Any chart developed should address one of the three views required by board members:
- Tactical: Used to monitor the processes supporting the association’s strategic initiatives. Tactical dashboards will aid board members in the decision-making process.
- Operational: Used for monitoring and analyzing the operational activity of a specific area (i.e. landscaping or security).
- Strategic: Used to track performance metrics against association strategic goals. These dashboards tend to summarize performance over a set period (i.e. monthly, quarterly or yearly).
- Group the data logically
It’s imperative to group like data together to keep focus and discussion on point. Do not try to mix assessment collection data with how much was spent on landscaping this past month. This only leads to disjointed discussions resulting in wasted time as well as showing a lack of board director alignment to homeowners.
- Make the data relevant to the audience
Any data and/or visual charts should highlight key items the board requires to understand a topic. For instance, a board may choose its focus to be on financial performance and infrastructure projects as homeowners value enhancing the community infrastructure but want to ensure capital is deployed efficiently to maintain the current dues level.
- Avoid dashboard clutter – Show only the most critical metrics
Dashboards are often overflowing with charts or tables giving a cluttered appearance. This clutter removes focus from the main dashboard message thereby compromising an efficient board review. If a topic needs multiple dashboards to tell a story, then split up the charts or tables. It’s better to have two slides that directors can follow versus a single cluttered slide that fails to convey the message.
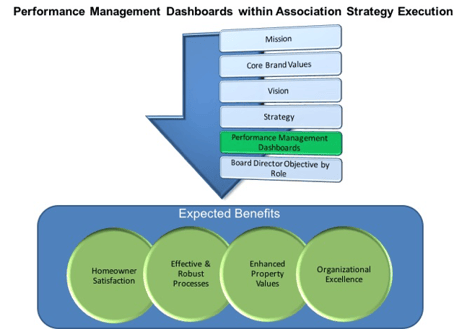
Benefits of Performance Management Dashboards
While an investment of time and effort by an association board is required, the panoply of benefits from a performance management dashboard structure justify making the investment. Here is a partial list of benefits an association board can expect to realize:
- Increased visibility and transparency
- Quickly identify patterns and anomalies in association operations
- Provide consistent view of association performance
- Effectively communicate strategy
- Reduce costs and redundancy
- Deliver actionable information
In summary, performance management dashboards provide an association board a report infrastructure designed to supply the right information to the right users at the right time. This will enhance a board’s ability to optimize decision making, improve efficiency, and accelerate the realization of results to the benefit of all homeowners. The time has come for association boards to conduct their management style as more Fortune 500 than social club. Steve Jobs stated it best when he said, “Be a yardstick of quality. Some people aren't used to an environment where excellence is expected”. Every director of a community association board should be working toward achieving an environment where excellence is the standard. Developing a performance management dashboard structure will help your board become that yardstick of quality.
Answers (3)
What are your thoughts on this topic?
Comments and postings are not legal advice, but are the opinions of our readers. This forum and its contents are being monitored. Please be respectful of each other.